Pattern profiles
This page describes the "profile data" itself (the measured dataset) that PDIndexer handles, and how to load, display, and export it. Processing applied after loading — smoothing, background subtraction, and so on — is done in the Profile Parameter window. For the full list of supported file extensions, see File formats.
What a profile is
A profile is a one-dimensional "horizontal axis vs. intensity" dataset obtained from a powder diffraction measurement. The horizontal axis is expressed in one of the following ways, depending on the measurement geometry:
- \( 2\theta \) (diffraction angle) for angle-dispersive diffraction (ordinary X-ray diffraction)
- Energy for energy-dispersive measurements (white X-rays, SSD detection)
- Flight time for the neutron time-of-flight (TOF) method
- In every case, the data can also be handled internally after conversion to the lattice spacing \( d \) or the scattering vector \( q \)
The vertical axis is the diffraction intensity, which can be shown as Raw Counts or Count per Step (CPS), on either a linear or logarithmic scale (see Vertical Axis on the Main window page).
Supported input formats
File ▸ Read profile(s) loads PDIndexer's own format as well as output from other programs and generic text formats.
| Extension | Contents |
|---|---|
pdi / pdi2 |
PDIndexer's native profile format (includes axis settings and processing information) |
csv |
WinPIP output (comma-separated) |
chi |
Fit2D output |
tsv |
Tab-separated text |
ras |
Rigaku (RAS) format |
nxs |
NeXus format |
npd / xbm / rpt (rpf) |
SSD (solid-state detector) raw data |
| Other text | Any two-column angle (or d-value)–intensity text is generally readable |
Reading generic text
Files stored as angle–intensity text can usually be read even if they are not one of the standard formats above. If the horizontal-axis type or the wavelength/energy cannot be determined, specify them in the Data Converter dialog described below.
The detailed specification of each format is collected in File formats.
How to load
Profiles can be loaded in several ways.
- Menu —
File ▸ Read profile(s). Multiple files can be selected at once. - Drag and drop — Drop files from Explorer onto the main window.
- Watch Clipboard — When
Option ▸ Watch Clipboardis enabled, profiles/crystals copied from other apps (e.g. IPAnalyzer or CSManager) are imported automatically. - Watch File — When
Option ▸ Watch Fileis enabled and a folder is chosen withSet Directory to the watch, newly createdpdiprofile files in that folder are read automatically. This is convenient for real-time display during continuous measurement.
Aligning the horizontal axis automatically
Checking After reading profile, change horizontal axis switches the horizontal-axis display to match the newly loaded profile immediately after it is read.
Single Profile vs. Multi Profiles mode
Switch the display mode with Single/Multi Profile on the right side of the main window.
Single Profile— Loading a new profile replaces the previous data; only one profile is shown at a time.Multi Profiles— Loaded profiles are overlaid. UseIncreasing intensity by a profileto offset each profile's intensity slightly so that multiple curves are easier to distinguish. EnablingChange automatically colorassigns a drawing color to each profile automatically.
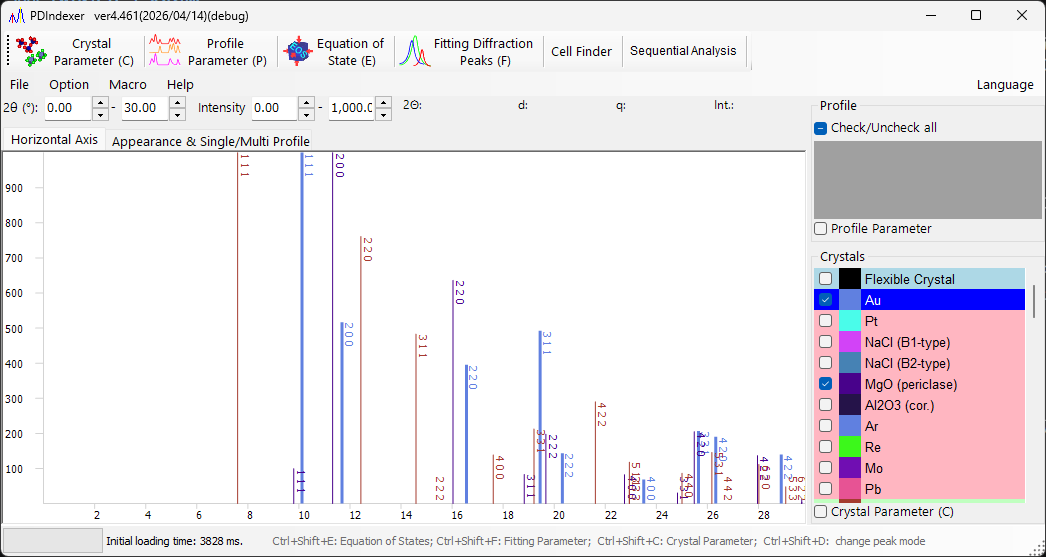
Profile checklist
The Profile list on the left side of the main window shows all loaded profiles.
- Only checked profiles are drawn in the central viewer. Use
Check/Uncheck allto toggle them all at once. - Click the
Colorcolumn to change the drawing color of each profile. - Reorder the entries in the list to adjust the overlay drawing order.
- The list is disabled in Single Profile mode and shows multiple profiles in Multi Profiles mode.
More detailed profile settings (name, line style, smoothing, background subtraction, axis correction, profile operations, and so on) are made in the Profile Parameter window, opened by checking the Profile Parameter checkbox below the list.
Data Converter dialog
When you load a generic text file whose horizontal-axis type cannot be determined, or SSD (energy-dispersive) raw data, the Data Converter dialog opens so you can specify the horizontal axis of the data being read and its associated parameters.
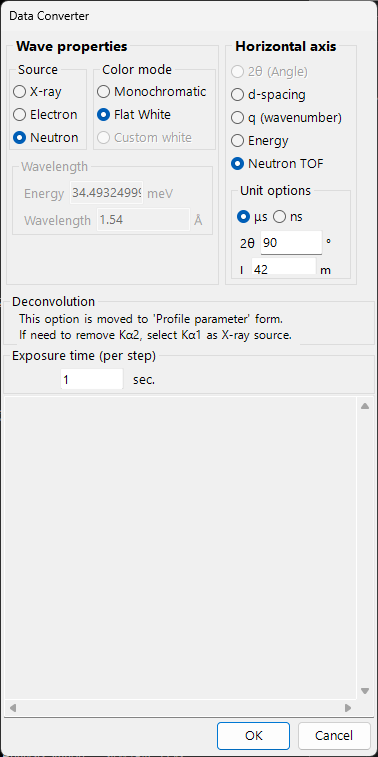
The dialog sets the following items.
| Item | Contents |
|---|---|
| Horizontal axis setting | Specify the data's horizontal-axis type (X-ray wavelength/energy, 2θ, neutron TOF length/angle, etc.) and the matching source parameters. |
Exposure time (per step) |
Exposure (measurement) time per data step, in seconds. It is used for the CPS conversion; values ≤ 0 are treated as 1. |
Deconvolution |
Kα2 removal has moved to the Profile Parameter form. To remove it, select Kα1 as the X-ray source. |
Low energy cutoff under For SSD data |
Discards the low-energy side of the EDX spectrum below the threshold (eV) at right. |
When the horizontal-axis type is energy-dispersive (white X-rays, EDX), enter the energy-calibration coefficients of E = a₀ + a₁ n + a₂ n² (E: energy in eV, n: channel number) to convert channel numbers into energy. Click OK to apply the settings and convert the data, or Cancel to abort the import.
Exporting profiles
File ▸ Save profile(s)— Saves all loaded profiles in PDIndexer's nativepdi2format. Axis settings and processing information are preserved.File ▸ Export the selected profile(s)— Exports the selected profile(s) in one of the following formats:as CSV (comma separated values) file— comma-separated (angle, intensity)as TSV (tab separated values) file— tab-separatedas GSAS file— GSAS (Rietveld) data format
Saving the figure
To save the rendered figure rather than the profile data, use File ▸ Copy to Clipboard or File ▸ Save as Metafile (EMF). EMF is a vector format that can be imported into PowerPoint and Word.