Beam Interaction
Beam Interaction describes how the selected crystal interacts with an incident beam of X-rays, electrons, or neutrons. For one chosen radiation it computes the allowed reflections and their structure factors, the attenuation and transport of the beam through the material, the atomic scattering factors of each element, and (for X-rays) the characteristic fluorescence lines. Switching the radiation type at the top recomputes everything, so the same crystal can be compared across diffraction and spectroscopy techniques.
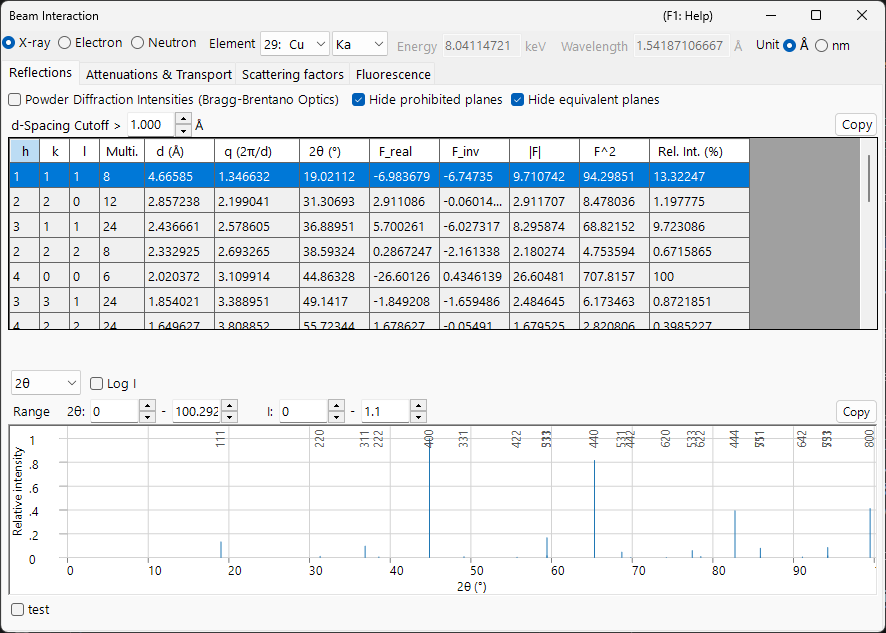
The incident beam is selected in the band at the top of the window; the four tabs below — Reflections, Attenuations & Transport, Scattering factors, and Fluorescence — show the different aspects of the interaction. Each tab section below shows the tab under X-ray / Electron / Neutron beams (use the tabs in each figure); the content changes markedly with the beam.
Solid-state background (Appendix A2)
The scattering and solid-state physics behind these four tabs — atomic scattering factors, the structure factor, beam attenuation and transport, and fluorescence — are explained in Appendix A2. Beam interaction (solid-state background).
X-ray data and the bundled xraylib library
Many of the X-ray quantities (anomalous dispersion \(f'/f''\), the \(F(q)+S(q)\) scattering split, the photo / Rayleigh / Compton breakdown of the mass attenuation, absorption-edge jumps, and fluorescence yields) are evaluated with the bundled xraylib library. If xraylib is unavailable, ReciPro falls back to its internal tables (photoabsorption-only attenuation, characteristic-line energies only) and the affected cells show N/A. The source row of each table states which data set was used.
Keyboard & mouse shortcuts
This window has no special key combinations. F1 opens this manual page. On the Scattering factors tab the vertical cursor line can be dragged to read off the scattering factor of each element at that position, and every tab has a Copy button that exports its table as spreadsheet-pasteable text.
→ See 21. Keyboard & mouse shortcuts for every window at a glance.
Beam and wavelength
The top band is a Wave Length Control shared with the other simulators.

- X-ray / Electron / Neutron : the atomic scattering factors and the interaction physics differ by the type of incident beam, so they are switched here.
- For X-ray, choosing the Element (anode material) and characteristic line (Kα, etc.) sets the wavelength of that characteristic X-ray automatically.
- Energy (keV) and Wavelength (Å) are linked; setting either updates the other, and both drive the 2θ used in the Reflections table.
- Unit (Å / nm) switches the length unit used for d-spacing and similar quantities.
The chosen beam also decides which tabs and curves are meaningful:
| Beam | Reflections | Attenuations & Transport | Scattering factors | Fluorescence |
|---|---|---|---|---|
| X-ray | structure factors incl. anomalous dispersion | µ/ρ, µ, transmission + absorption edges (vs energy) | \(f(s)\) (Waasmaier–Kirfel or Temari) or \(F(q)+S(q)\) | characteristic lines + EDX sticks |
| Electron | electron structure factors | σ, MFP, |dE/ds|, IMFP, range (vs energy) | Peng / Kirkland / 8-Gaussians / Temari | — (hidden) |
| Neutron | nuclear structure factors | scattering lengths & cross sections (no energy curve) | scattering lengths (no s dependence) | — (hidden) |
The Fluorescence tab is X-ray-only and disappears for electron and neutron beams. For neutrons the energy-dependent graphs in Attenuations & Transport and Scattering factors are replaced by element tables, because the nuclear scattering length does not depend on scattering angle or energy.
Reflections tab
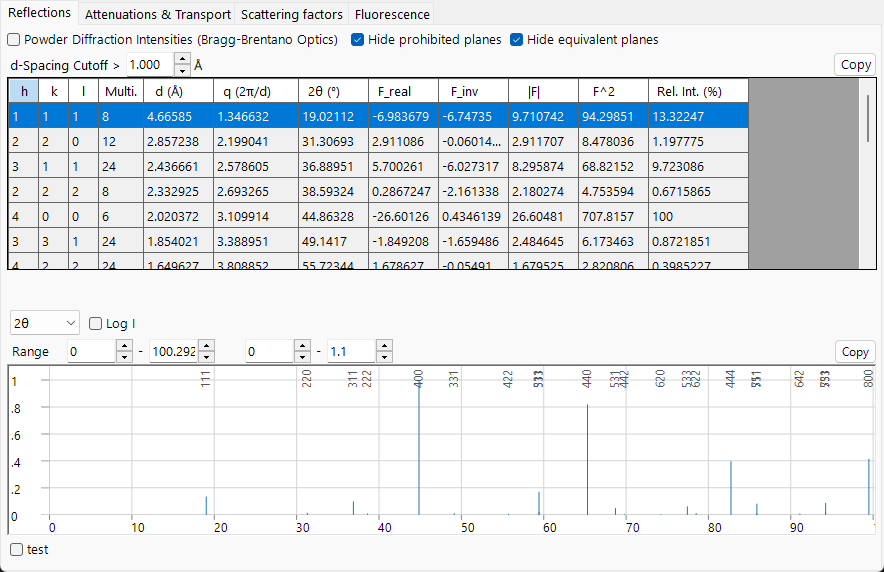
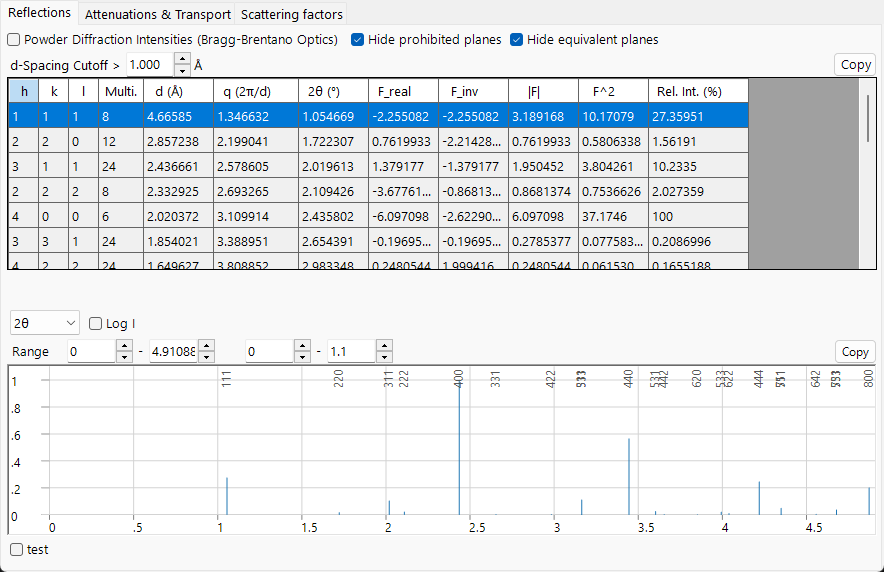
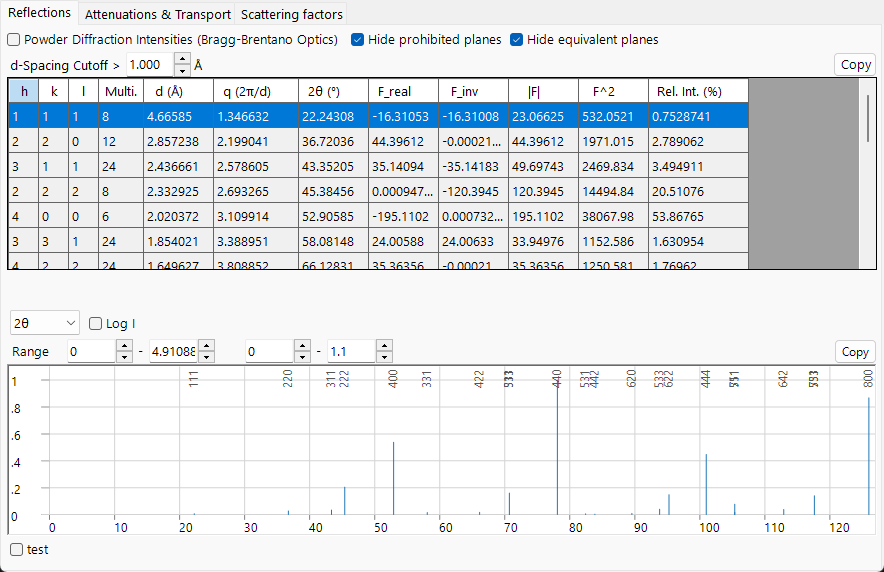
Lists the allowed crystal planes (reflections) of the crystal and the structure factor and diffraction intensity of each. For X-rays the structure factor now includes the anomalous dispersion terms \(f'/f''\) at the current energy, so F_inv (the imaginary part) is generally non-zero near an absorption edge. The layout is the same for every beam; only the structure-factor values and the 2θ of each reflection change.
Options
- Powder Diffraction Intensities (Bragg-Brentano Optics) : computes the relative intensity as a powder-diffraction (Bragg–Brentano) intensity, including multiplicity and the Lorentz–polarization factor. When off, it displays the structure-factor intensity. Turning it on also forces Hide equivalent planes and Hide prohibited planes on.
- Hide equivalent planes : collapses crystallographically equivalent planes into a single entry.
- Hide prohibited planes : excludes planes whose intensity is zero by the extinction rules.
- d-Spacing Cutoff > : excludes reflections with a d-spacing smaller than this value (length unit follows the Unit selection).
Each row is one reflection (or a group of symmetry-equivalent planes):
| Column | Meaning |
|---|---|
| h, k, l | Miller indices |
| Multi. | multiplicity (number of symmetry-equivalent planes) |
| d (Å) | interplanar spacing |
| q (2π/d) | magnitude of the scattering vector |
| 2θ (°) | diffraction angle for the selected wavelength |
| F_real | real part of the structure factor |
| F_inv | imaginary part of the structure factor (non-zero with X-ray anomalous dispersion) |
| |F| | structure-factor amplitude (\(= \sqrt{F_\text{real}^2 + F_\text{inv}^2}\)) |
| F^2 | structure-factor intensity (\(\lvert F\rvert^2\)) |
| Rel. Int. (%) | relative intensity, with the strongest reflection set to 100 |
Diffraction-peak plot. Below the table the same reflections are drawn as a stick pattern, with the strongest peaks labelled by their hkl.
- The horizontal-axis selector chooses among 2θ (scattering angle in degrees), d (lattice-plane spacing), and Q (\(= 4\pi\sin\theta/\lambda\), the scattering vector / momentum transfer). The three options describe the same reflections; only the horizontal scale changes.
- Log I switches the intensity axis between linear and logarithmic. Diffraction intensities span many orders of magnitude, so a logarithmic scale stretches the bottom to reveal the weak peaks that a linear scale flattens against the baseline.
- The Range boxes set the plotted horizontal and intensity range.
Attenuations & Transport tab
How far the beam penetrates the material and how it loses energy. The content depends on the beam.
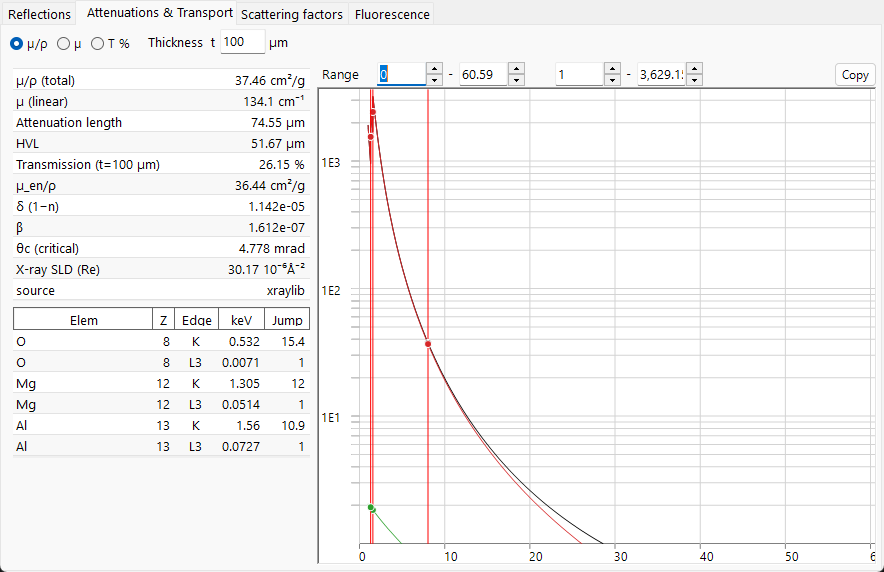
X-ray
The radio buttons choose the plotted coefficient against photon energy (1–60 keV, logarithmic axis):
- µ/ρ — the mass attenuation coefficient (cm²/g): how strongly the material removes X-rays per gram, independent of how densely it is packed (this is the value found in reference tables). The graph shows the total together with its photo, Rayleigh, and Compton components.
- µ — the linear attenuation coefficient \(\mu = (\mu/\rho)\cdot\rho\) (cm⁻¹): the attenuation per centimetre of the actual material at its real density. The transmitted intensity follows \(I = I_0\,e^{-\mu t}\), and \(1/\mu\) is the distance over which the intensity falls to about 37 % (1/e).
- T % — the transmission \(T = e^{-\mu t}\) in percent for the sample thickness t set in the Thickness t box (µm). 100 % = transparent, 0 % = fully blocked; use this to judge a sensible sample thickness at the current energy.
The vertical lines mark the current energy and each element's absorption edges. The scalar table on the left lists, at the current energy: µ/ρ (total), µ (linear), Attenuation length (\(1/\mu\)), HVL (half-value layer, \(\ln 2/\mu\)), Transmission at thickness t, µ_en/ρ (mass energy-absorption coefficient), the X-ray refractive-index decrements δ and β (\(n = 1-\delta+i\beta\)), the θc (critical) angle for total external reflection, and the real X-ray SLD (scattering-length density). The lower table lists the K and L3 absorption edge energies and their Jump ratios for each element.
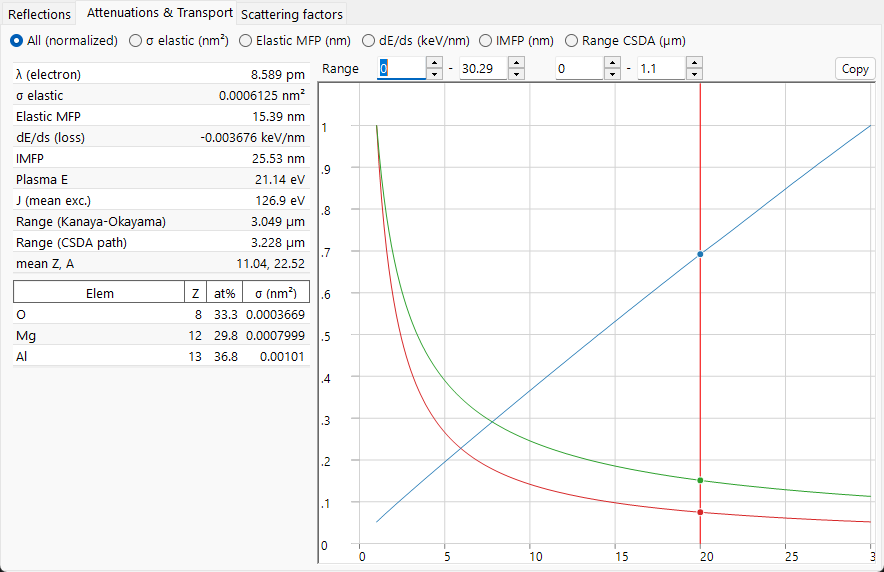
Electron
The quantity selector chooses what is plotted against beam energy (1–30 keV):
- All (normalized) — overlays the three curves below, each rescaled to its own maximum so the shapes can be compared on one plot (read absolute values from the table).
- σ elastic (nm²) — elastic scattering cross section: how likely a single atom is to deflect the electron.
- Elastic MFP (nm) — mean free path: the average distance the electron travels between elastic scattering events.
- |dE/ds| (keV/nm) — stopping power magnitude: the energy the electron loses per nanometre of travel.
- IMFP (nm) — inelastic mean free path: the average distance between energy-losing collisions.
- Range CSDA (µm) — the total path length the electron travels before it stops.
The scalar table lists the electron wavelength, σ elastic, Elastic MFP, |dE/ds|, IMFP, the Plasma E and mean excitation energy J, two electron ranges (the Kanaya–Okayama penetration estimate and the CSDA integrated path length), and the mean Z, A. The per-element table gives each element's atomic fraction and elastic cross section σ. The elastic cross sections use the NIST Mott data (50 eV–36 keV) and fall back to screened Rutherford above 36 keV.
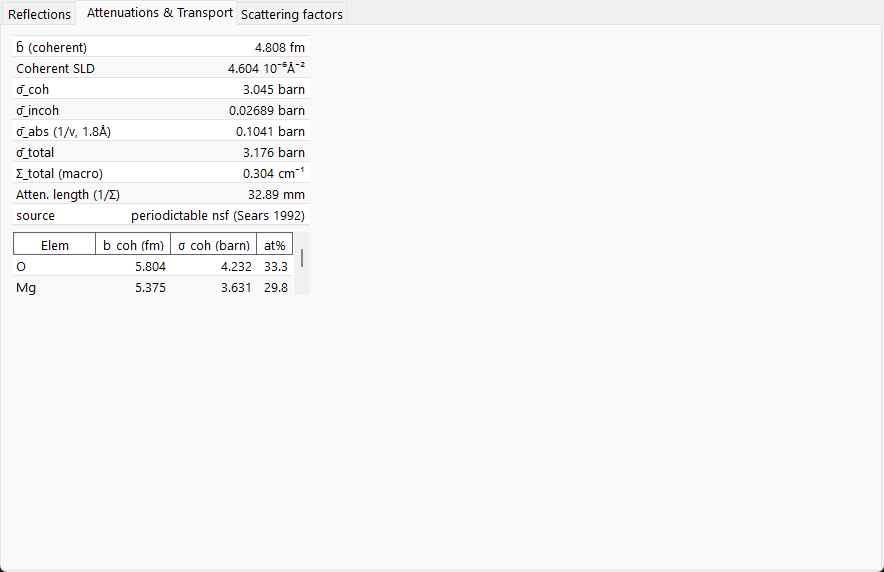
Neutron
Neutron interaction is set by nuclear cross sections rather than an energy-dependent curve, so this tab shows tables only. The scalar table lists the mean coherent scattering length b̄, the Coherent SLD, the averaged coherent / incoherent / absorption / total cross sections (σ̄_coh, σ̄_incoh, σ̄_abs, σ̄_total), the macroscopic total cross section Σ_total and the corresponding attenuation length. The absorption cross section is evaluated with the 1/v law at the current wavelength; nuclides where this is invalid (Cd, Sm, Eu, Gd resonant absorbers) are flagged. The per-element table lists b_coh, σ_coh, and the atomic fraction.
Scattering factors tab
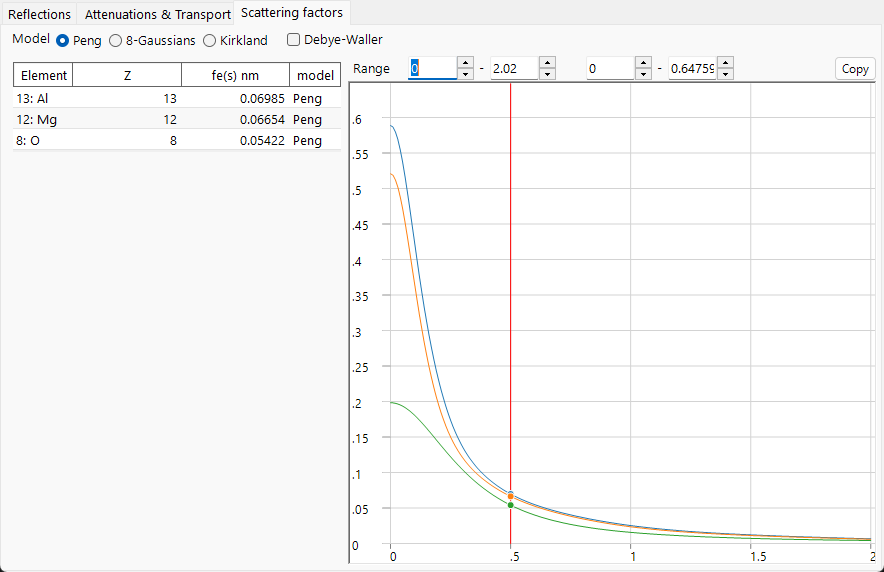
The atomic scattering factor of each constituent element, plotted against \(s = \sin\theta/\lambda\) (Å⁻¹). Each element is drawn in its own colour, and the vertical cursor line can be dragged to read off the scattering factor of every element at that position into the table on the left.
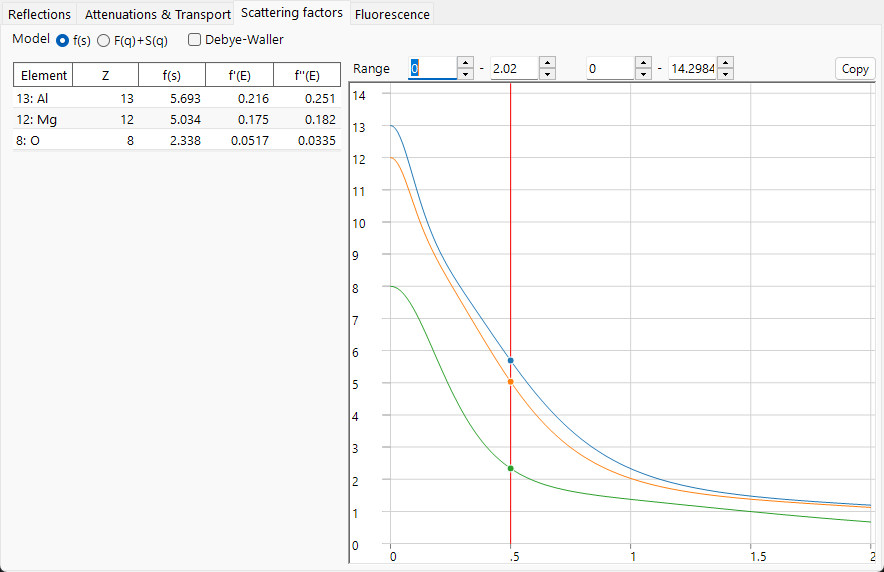
- X-ray offers two Model modes: f(s) plots the conventional X-ray atomic scattering factor (in electron units); F(q)+S(q) plots the Rayleigh coherent form factor \(F(q)\) together with the Compton incoherent scattering function \(S(q)\) (from xraylib). The table also lists the anomalous-dispersion terms f'(E) and f''(E) at the current energy, and a model column naming the source the f(s) column came from. When f(s) is selected, a second row of radio buttons chooses where the curve comes from — Waasmaier–Kirfel (the default fit, which also covers ions over Z = 1–98) or Temari. It is greyed out while F(q)+S(q) is showing, because those two curves come from xraylib and have no source choice.
- Electron offers four sources for the electron scattering factor: Peng, Kirkland, 8-Gaussians and Temari. The table shows \(f_e(s)\) (nm) and which model produced it.
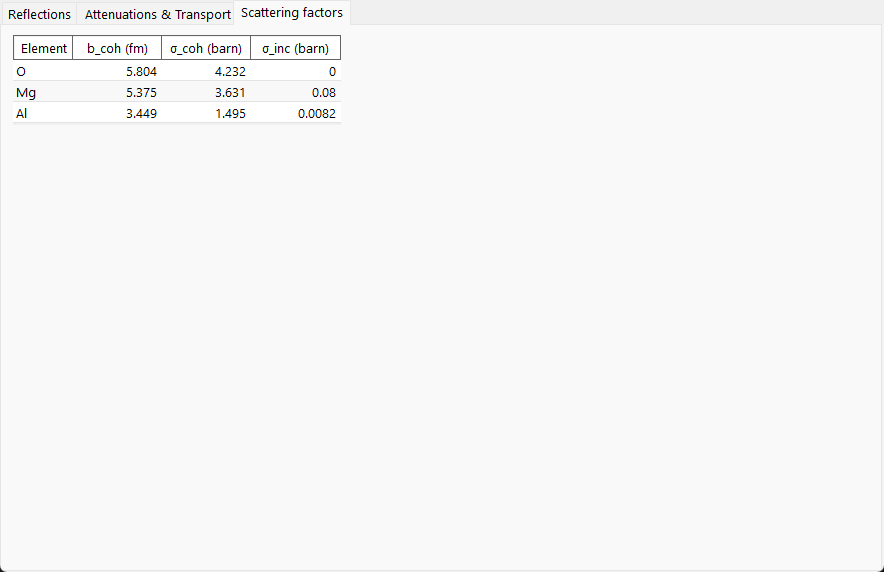
- Neutron scattering lengths do not depend on \(s\), so no curve is drawn; the table lists each element's coherent scattering length b_coh and its coherent / incoherent cross sections.
- Temari is not a fit but a computed table (Temari dataset-factors v2.0.0, CC-BY-4.0, from a full Dirac self-consistent-field calculation). It covers neutral atoms Z = 1–86 only: ions and Z = 87–98 have no entry, so their curves are omitted and their table cells left blank rather than filled with neutral-atom values.
- Debye-Waller multiplies each factor by the thermal damping \(e^{-B s^2}\) using each atom's isotropic displacement parameter.
Fluorescence tab
For an X-ray beam, the characteristic fluorescence emission of the sample. (This tab is hidden for electron and neutron beams.)
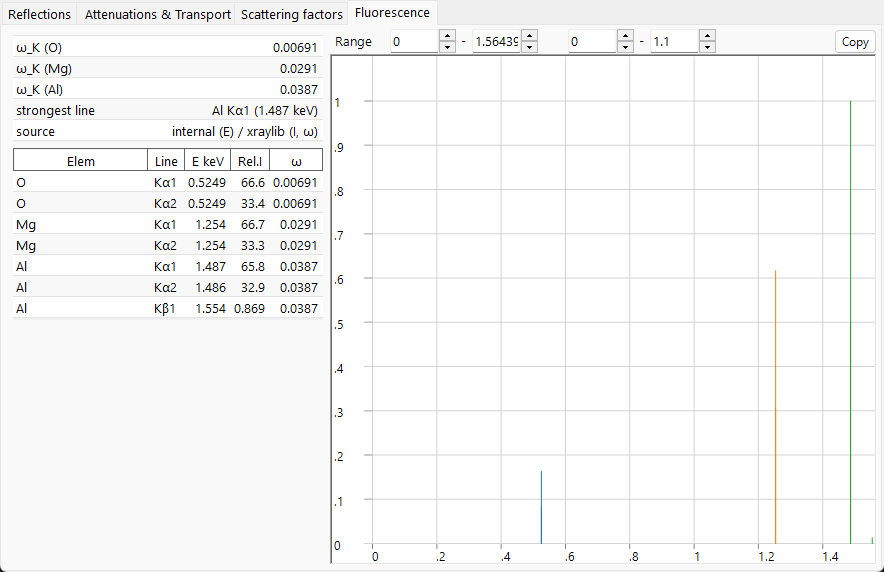
The EDX emission lines plot draws the characteristic lines (Kα1, Kα2, Kβ1, Lα1, Lα2, Lβ1) of every element as sticks at their photon energies, with the height proportional to the atomic fraction × radiative rate × fluorescence yield (a qualitative EDX-style preview; excitation cross section and detector efficiency are not modelled). The lower table lists, per line, the element, line name, energy E keV, relative intensity Rel.I, and the fluorescence yield ω. The scalar table reports the K-shell yield ω_K of each element and the strongest line in the spectrum.
Copy to Clipboard
Each tab has a Copy button that copies its table to the clipboard as text that can be pasted into a spreadsheet such as Excel.
See also
- Crystal database — defining the crystal whose interaction is calculated.
- Diffraction simulator — simulating diffraction patterns using the structure factors.
- Appendix A2. Beam interaction (solid-state background) — the scattering and solid-state physics behind every tab.