Stereonet
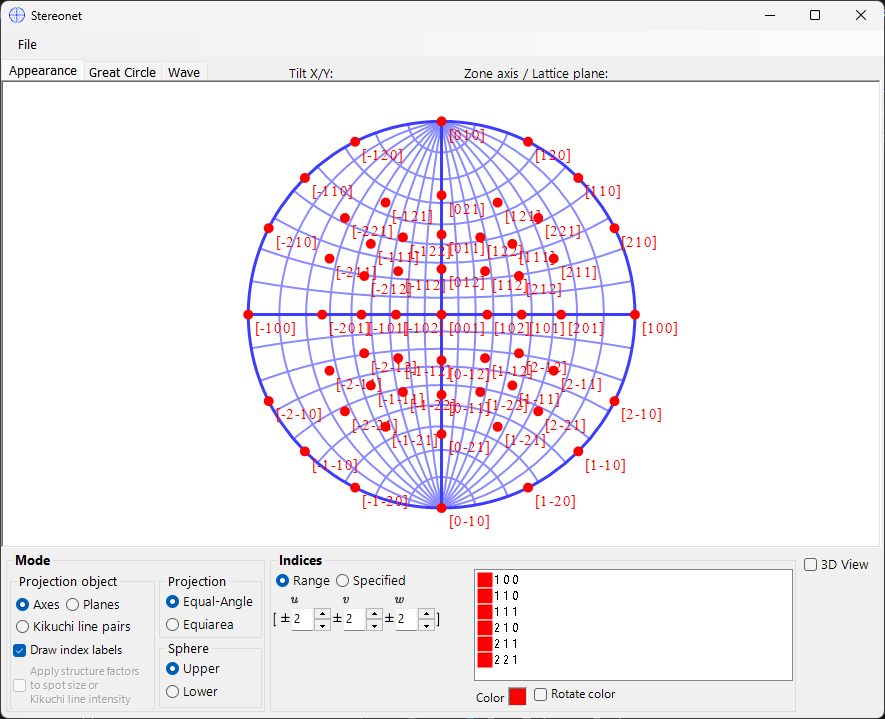
Stereonet displays crystal plane and axis directions using stereographic projection.
Keyboard & mouse shortcuts
The stereonet itself is a 2-D projection; an optional 3-D sphere can be shown with 3D display.
| Shortcut | Action |
|---|---|
| F1 | Open this page of the online manual |
| Left-drag near the centre | Tilt the crystal |
| Left-drag the outer area | Spin the crystal about the view axis |
| Left double-click | Switch between Plane and Axis projection |
| Right-click | Zoom out |
| Right-drag a box | Zoom in to the selected region |
| Middle-drag | Pan |
| Move the mouse (no button) | Read off the (hkl)/[uvw] under the cursor — useful for indexing a measured spot |
Dragging on the net rotates the crystal; the rotation state is shared across all windows.
The 3-D rendering uses ReciPro's standard OpenGL view navigation (left-drag rotate, right-drag / wheel zoom, CTRL + right double-click toggles projection) and rotates only the 3-D view, not the crystal itself.
The application-wide CTRL+SHIFT shortcuts from the main window also work while this window is focused.
→ See 21. Keyboard & mouse shortcuts for every window at a glance.
Main area
The stereonet projection of the selected crystal's crystal planes, direction indices, and Kikuchi lines is displayed.
File menu
Save or copy in raster or vector format. Vector format allows editing font/line thickness in PowerPoint or other vector editors.
Mode
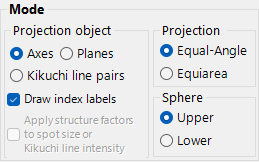
Projection target
Select what to project onto the net.
- Axes — projects direction indices \([uvw]\).
- Planes — projects crystal-plane normals \((hkl)\).
- Kikuchi line pairs — projects Kikuchi-line pairs.
Projection method
| Method | Description |
|---|---|
| Wulff (equal-angle / stereographic) | Preserves the angle relation between projected features but not solid angle. Used by classical crystallographers when reading inter-axis or inter-plane angles. |
| Schmidt (equal-area / Lambert) | Preserves the solid-angle (area) of each region but distorts angles. Preferred for statistical pole figures where relative density matters. |
Hemisphere
Choose Upper or Lower hemisphere as the projection source — switches whether the visible face of the sphere is the one closest to or farthest from the observer.
Display options
- Show index labels.
- When Planes or Kikuchi line pairs is selected, weight each point or line by the structure factor \(|F_{hkl}|\) (set the wave source and wavelength in the Wave tab).
For trigonal/hexagonal crystals, Miller–Bravais (4-index) notation can be enabled from Option ▸ Use Miller-Bravais (hkil) index in the main window.
Indices
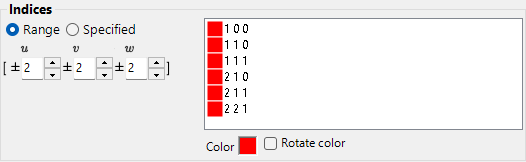
Sets which crystal planes / axes are drawn.
Range mode
Specify a range of \([uvw]\) or \((hkl)\) indices. ReciPro enumerates every index within the limits and projects each one.
Specified mode
Specifies particular axes or planes individually. Type an index, press Add to register it, or Remove to delete it. When include equivalent indices is checked, all crystallographically equivalent indices are drawn as well.
Colour / Size
Set the colour and size of the plotted points. Tick Change colour automatically to colour-code each set of equivalent axes/planes differently — useful for distinguishing families on a multi-index plot.
3D Options
Controls the 3D net (sphere) overlay — opacity of the sphere, axis indicators, etc.
Tab menu
Appearance
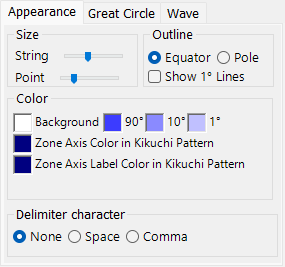
Outline
How the stereonet outline is drawn — the bounding circle and the optional great-circle latitude/longitude grid. Pick Equator or Pole, toggle 1° Lines and the Background fill, set the 90° / 10° / 1° grid colours, and adjust the Line width with the track bar.
Index labels
- Size — size of the index labels.
- Specify color — use a single fixed colour for all index labels instead of the per-spot colour, useful when the points are colour-coded but you want all labels in one colour for readability.
- Delimiter — character placed between the indices in each label: None (e.g. 100), Space (1 0 0), or Comma (1,0,0).
Kikuchi line mode
- Point size — size of the plotted points.
- Point / Label — colours of the points and their labels.
Great and Small Circle
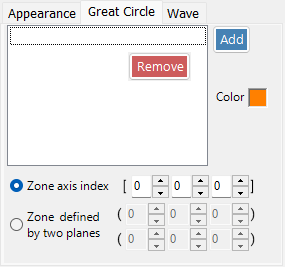
Draw great circles and small circles. Specify either by zone-axis index \([uvw]\) (the great circle formed by the zone of that axis) or by two crystal-plane indices that share the zone axis. The line width of the circles is also configurable via track bar.
Wave
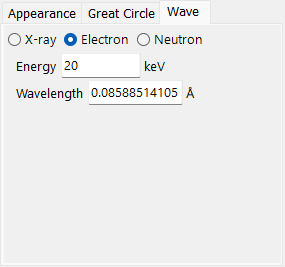
Available only when Planes or Kikuchi line pairs is selected as the projection target. Sets the wave source (X-ray / electron / neutron) and the wavelength or energy required to compute the crystal structure factors used for the structure-factor weighting option in Mode.