Fluorescence
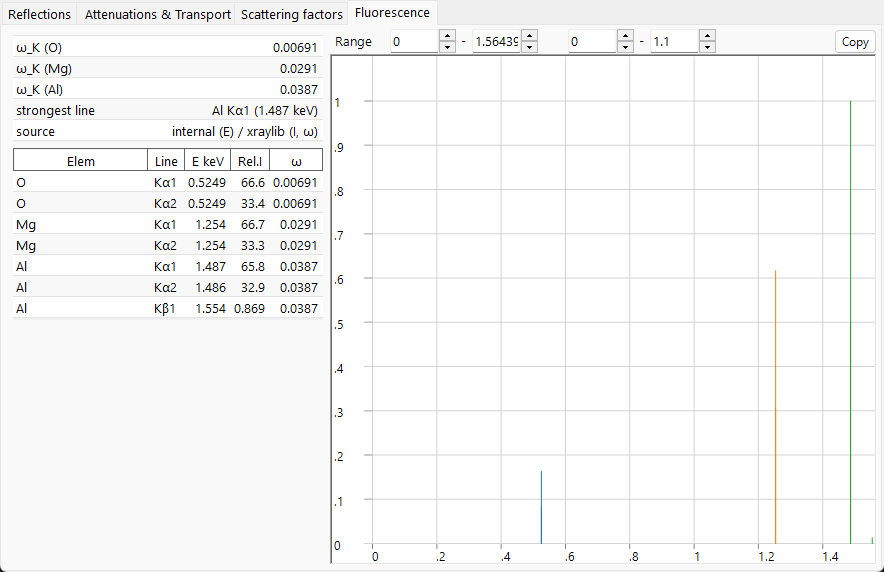
When X-ray photoabsorption ejects an inner-shell electron (see attenuation & transport), it leaves a vacancy in a deep level. The atom relaxes by dropping an outer electron into the hole, and the released energy comes out either as a characteristic X-ray photon (fluorescence) or by ejecting a second electron (the Auger process). The Fluorescence tab previews the characteristic-photon channel; it is X-ray-only and hidden for electron and neutron beams.
Characteristic lines
Because the shell energies are sharply defined, the emitted photon energy is the difference of two binding energies,
and is therefore characteristic of the element:
- K lines — vacancy in the \(K\) shell filled from \(L\) (\(K\alpha\)) or \(M\) (\(K\beta\)).
- L lines — vacancy in the \(L\) shell filled from \(M\)/\(N\) (\(L\alpha\), \(L\beta\), …).
The spectrum is a few discrete lines (K\(\alpha_1\), K\(\alpha_2\), K\(\beta_1\), L\(\alpha_1\), …) rather than a continuum because the shell energies themselves are quantised; the electric-dipole selection rules then decide which of those transitions are strong (weaker forbidden, multipole and satellite lines do exist). Their energies follow Moseley's law; in the screened-hydrogenic approximation,
with \(\sigma\) a screening constant. For \(K\alpha\) (\(n_2{=}2\to n_1{=}1\), \(\sigma\approx1\)) this reduces to \(E_{K\alpha}\approx R_\infty hc\,(Z-1)^2\left(1-\tfrac14\right)\). The \(Z\) dependence is driven by the nuclear charge, merely screened by the remaining electrons, so it is monotonic and essentially insensitive to chemical state — which is what makes it the basis of elemental identification (EDX/WDX).
Fluorescence yield
The competition between radiative and Auger relaxation is captured by the fluorescence yield
the probability that a given vacancy decays by emitting a photon rather than an Auger electron (\(\Gamma_r\), \(\Gamma_a\) are the radiative and Auger rates).
- For light elements the Auger channel dominates, so \(\omega_K\) is small (well below 1% for C, N, O) — light elements fluoresce weakly, which is why they are hard to detect by EDX.
- For heavy elements the radiative channel wins and \(\omega_K \to\) near 1.
The complementary Auger yield \(a\) takes the rest, so
and a small \(\omega\) means most vacancies decay by Auger emission. Within the radiative channel, the share of one particular line \(\ell\) (e.g. \(K\alpha_1\) vs \(K\beta_1\)) is its branching ratio
the relative radiative rate within shell \(X\). ReciPro lists \(\omega_K\) for each element and the strongest line in the spectrum.
What the preview does and does not model
The EDX emission lines plot draws each characteristic line as a stick at its photon energy with height proportional to
This is a qualitative preview of where the lines fall and their rough relative heights. It deliberately omits the factors that a real, quantitative EDX/XRF spectrum requires:
- whether the incident energy is actually above the absorption edge needed to create the vacancy — a line is drawn even if it cannot be excited at the current energy;
- the excitation cross section (how efficiently the incident beam creates the vacancy at the chosen energy);
- self-absorption of the emitted photons within the sample (matrix effects);
- detector efficiency and resolution.
So the preview is for line identification and relative-position reasoning, not for quantitative composition.
From preview to quantification
A real EDX/XRF analysis converts line intensities into concentrations through a matrix (ZAF) correction — for atomic number (\(Z\)), absorption (\(A\)) of the emitted photons on their way out of the sample, and secondary fluorescence (\(F\)) excited by other lines — combined with the excitation cross section and detector response noted above. In full form the measured intensity of line \(\ell\) from element \(i\) is
with \(C_i\) the concentration, \(\Phi_0\) the incident flux, \(\sigma_\text{ion}\) the ionisation cross section, \(\omega\) the fluorescence yield, \(p_{\ell\mid X}\) the branching ratio, \(\epsilon\) the detector efficiency, and \(A_\text{matrix}\) the absorption / secondary-fluorescence correction. ReciPro's preview keeps only the \(C_i\,p_{\ell\mid X}\,\omega\) part (atomic fraction × radiative rate × yield) and drops the rest, so it places the lines and gives their intrinsic relative strengths so that they can be recognised in a measured spectrum.
See also
- Attenuation & transport — photoabsorption, the edge that creates the vacancy.
- Atomic scattering factors — the same bound electrons, seen in scattering.
- 3. Beam interaction → Fluorescence tab